Maslow's hierarchy of needs says humans can only reach their full potential if our basic needs are met. The hierarchy has five levels, and we must satisfy each level to move on to the next.
If we don't have this strong foundation, the higher levels will crumble, leading to negative consequences.
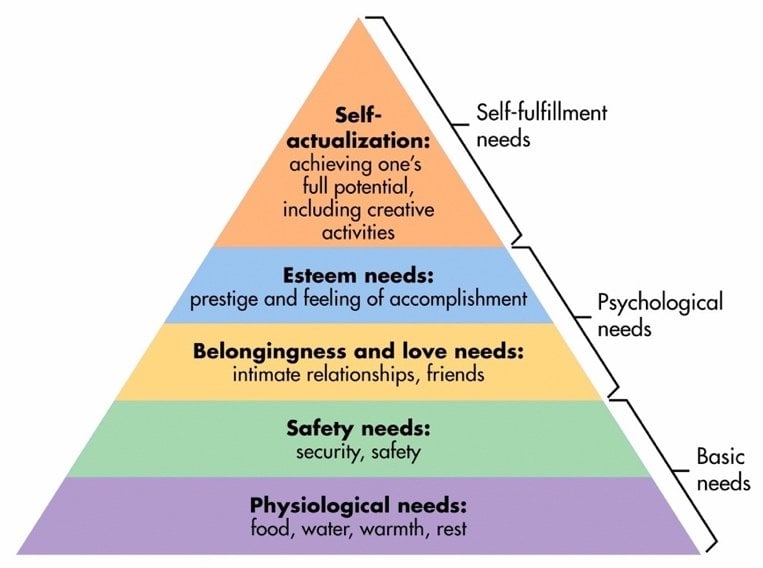
Maslow's hierarchy of needs is a theory that arranges human needs into a hierarchical structure, progressing from basic physiological requirements to higher-level psychological and self-fulfillment needs.
This same idea can be applied to Machine Learning (ML). While fancy ML techniques are great, they have their time and place and differ from the need for a solid ML foundation.
In this blog post, we will use Maslow's hierarchy of needs to illustrate how technical leaders can build a machine learning (ML) solution foundation. We believe that this comparison will make the ML model-building process easier to understand.
After reading this post, we encourage you to check out our accompanying blog post that explores how business leaders can build an ML model-building process using Maslow's hierarchy of needs as a framework.
The following graphic illustrates the different stages of Maslow's hierarchy of needs in the context of building a ML solution foundation for technical leaders:
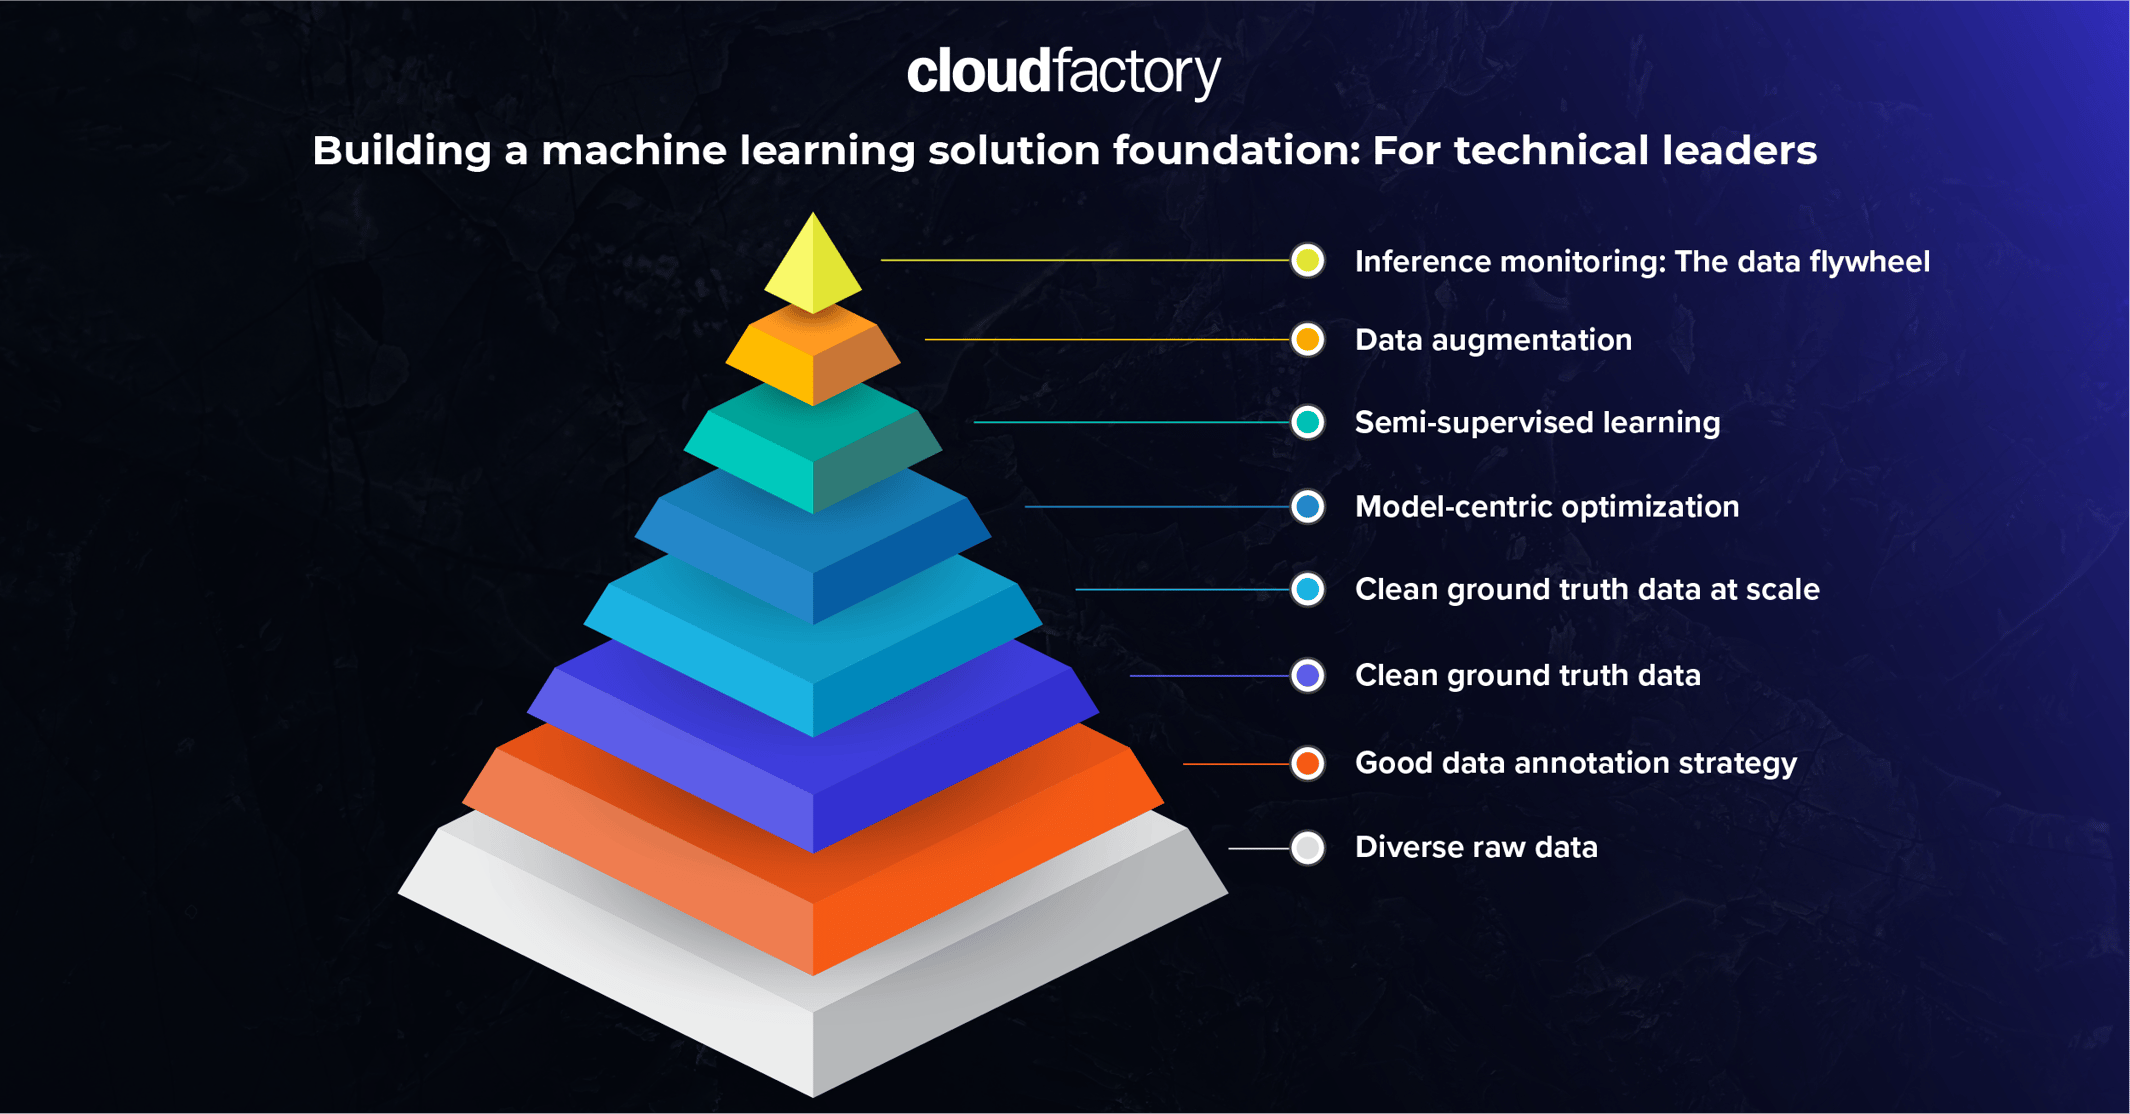
1. Diverse raw data
The more diverse your data is, the more real-world variance the model will learn and the better it will perform in the wild.
You want to cover as much of a normal distribution of your data as possible.
So, if you're building a facial recognition system to greet users when they unlock their cell phones, you'll train the model on photos of people’s faces.
If it works perfectly, you'll start making sales, and everyone will be happy.
Until…
You start getting complaints that your system doesn't recognize people when they smile or make grimaces. This might be because, in your dataset, people had neutral, still facial expressions, which is not always the case in the real world.
Another common problem is class imbalance.
When there aren't many examples of a certain class, the model tends to choose the more common class most of the time because it's usually right more often that way.
For example, imagine you're building a model to detect brain tumors from an MRI, but in the images received from the clinic, most patients didn't have tumors. As a result, when deployed to production, your model will often miss out on cases where the tumor is present because it was more likely to be the correct answer in training.
Another common error is arranging video frames in order, as similar frames in a row don't differ much. It's smarter to pick varied frames first so your model learns faster.
Key Takeaway: Diversify your data and address class imbalance early on. If your dataset represents real-world data, the model will perform notably better in production.
2. Good data annotation strategy
Computer vision projects typically start with preparing the dataset and data annotation. But before beginning any labeling work, you must decide how exactly you will label the images. This strategic choice sets the tone for everything, including the model families you can use and the effort needed to label the data.
But be prepared.
Teams usually have to repeat or redo this strategy about eight times before finding a consistent way of marking things, like deciding on categories and labels.
Key decisions to make here are:
- Label classes: Including distinctions between what should be a separate class or what should be denoted with attribution.
- Label type: Consideration is given for occlusion and label noise. Boxes, masks, polygons, or keypoints all make sense.
- Class type: This would be an object or semantic class, depending on whether the exact instance is important.
These decisions might seem trivial, but consider the case when looking at cracks in buildings. Should types of cracks be different classes, or should they all have the class "crack" and then the type attributed?
Would you use semantic or instance segmentation? Would that differ for types of cracks? What about things that look like cracks but are not cracks (like electric wires)?
The frustrating answer is that it all depends on the use case's requirements.
This is where experience makes a massive impact.
Key Takeaway: Data annotation is a major cost in machine learning projects. It can take up a significant amount of budget, so it's important to iterate quickly and find the right formula. If you don't, you'll waste time and money and be less likely to succeed.
3. Clean ground truth data
You can't overestimate the importance of clean ground truth data. Even if you have a diverse dataset but incorrect ground truth labels, model predictions will be flawed.
Some reasons why errors in ground truth labels occur are:
- Ambiguity: Some data points may be difficult to label due to ambiguity or subjective interpretation. For example, an image of a person could be labeled as "happy" by one person, while another may label it as "content." The problem is exacerbated if you have not prepared detailed data annotation guidelines beforehand.
- Biases: People may unconsciously or consciously bias ground truth labels. For example, they might label a woman in a medical suit as a nurse while labeling a man in a suit as a doctor.
- Outliers: Data points may be outliers that need to fit neatly into the existing categories. If the annotator needs help labeling these data points, they may assign an incorrect label.
- Human error: Data annotators may accidentally mislabel images, especially if the labeling process lacks automation and requires tedious, repetitive manual labeling.
- Technical: Errors made during importing or exporting annotations.
Key takeaway: Aspire to eliminate errors in labels early on. Provide clear, unambiguous guidelines to annotators and make sure the data annotations are imported correctly. Otherwise, training on even large datasets will not yield satisfactory results. Remember the golden rule in ML: “Garbage in, garbage out.”
4. Clean ground truth data at scale
Manual quality assurance and control are feasible when you work on a small project without worrying about your time or budget. However, in most cases, manual quality assurance and control are costly and may take up to 40% of all time spent on data annotation.
To check ground truth at scale, an optimal solution is to involve automation in the process. In our data annotation tool, for instance, we offer AI consensus scoring (AI CS) – an AI-powered quality assurance feature that automatically finds potential annotation errors in your dataset. This solution lets you focus on fixing the errors rather than spending time finding them.
Some types of errors found after an AI CS run:
- Incorrect class (e.g., cat instead of a dog)
- Missing labels or extra labels
- Low Intersection over Union (IoU) - when the existing annotation and the annotation predicted by the model overlap too little.
- Ambiguity
Key takeaway: If you have a large dataset or plan to expand your project, use automated tools for quality assurance and control to reduce manual workload and free more time to fix the errors.
5. Model tuning and optimization
Once you get to developing a model, it's beneficial to remember about hyperparameter tuning and process optimization. This means using all the available instruments to adjust the model to solve your specific case, for example, playing with architectures, choosing hyperparameters, and evaluating with a proper metric like Intersection over Union for an object detection task.
Remember to track these experiments to see which set of parameters works best.
Many teams say that "every evaluation metric is important to us." But the reality is that there's no such thing as a perfect model. You need to find tolerances to get your model into production. This means relaxing some metrics so you can improve others.
The last thing successful ML teams need is the idea of perfection getting in the way of progress.
Some questions to ask yourself:
- Do we need pixel-perfect precision?
- Are we better off with false positives or false negatives?
- Can we implement other measures to allow the total system to tolerate certain model errors?
In the computer vision field, some common evaluation metrics are accuracy, confusion matrix, intersection over union (IoU), mean average precision (mAP), and others.
In our Hasty annotation tool, we use the following metrics:
- Object detection: mAP (mean Average Precision)
- Instance segmentation: mask mean Average Precision (mask mAP)
- Semantic segmentation: mean Intersection over Union
- Classification: Accuracy, F-beta score, precision, and recall
- Tagging: Hamming score, precision, and recall
- Attribute prediction: Hamming score, precision, and recall
However, hyperparameter tuning and process optimization are more than choosing an appropriate metric. For example, you can:
- Experiment with a neural network architecture
- Optimize the network's hyperparameters
- Expand the training dataset
- Apply data augmentation techniques
Key takeaway: Select a key metric concerning your task and business objectives, and try to optimize the model’s performance on that metric.
6. Semi-supervised learning
If you're working with large-scale datasets with millions of images, you might want to reduce the costs further and leverage the existing unlabeled data more wisely. In this case, semi-supervised learning (SSL) can be of help.
In contrast to supervised learning, where the model is trained only on labeled data, semi-supervised learning uses labeled and unlabeled data, with a teacher-student approach, to improve the model's accuracy.
One of the common SSL approaches is when a model first learns on a small set of labeled data and makes predictions for a large portion of unlabeled data. These predictions (so-called pseudo-labels) are then used as ground truth in the following iterations, and the process repeats until the model converges.
Hence, if your dataset is large and you have only a small percentage labeled (from 1% to 10%), save some time and try SSL.
Key takeaway: If you have a large dataset and only a small percentage of labeled data (1-10% of the whole dataset), try the semi-supervised learning technique to leverage the existing data and make labeling more efficient.
7. Data augmentation
Even though having large datasets is a significant advantage, oftentimes, it's not feasible to gather sufficient training data because of time or budget constraints. In this case, data augmentation helps improve your model's performance by making the existing data more diverse.
The data augmentation technique includes various manipulations with the images, for example, rotations, resizing, color jitter, blurring, and many more.
By using data augmentation, you can artificially increase the size of your dataset and help your model to learn more about the real world. This can lead to better accuracy, generalization, and robustness.
You can also use synthetic data, artificially generated data that imitates the characteristics of real-world data. Synthetic data is a valid way to augment existing datasets and improve model performance.
The advantages of using synthetic data are:
- It's relatively cheap and can be generated in large quantities.
- It can be used when real-world data is sensitive or confidential.
- You can control the characteristics of synthetic data; for example, you can generate images that imitate edge cases specifically.
Of course, the trade-off is that synthetic data may not always capture and reliably represent real-world complexity. Depending on the algorithm or the task, it might not be the best quality.
The primary mistake teams make is looking at synthetic data as a reliable substitute for a good ground truth dataset. This is attractive for the economic and time benefits, but we've never seen a model go into production reliably based on 100% synthetic data.
We highly recommend treating this as a complement to your dataset rather than a substitute.
Key takeaway: If your data is scarce, not diverse enough, or lacks examples of edge cases – try using techniques such as data augmentation or synthetic data generation to make your model more robust against real-world samples.
8. Inference monitoring: The data flywheel approach
Once you've deployed the model in a production environment, monitoring and tracking its performance is crucial to check whether everything works as expected and to diagnose issues early on. This process in ML is referred to as inference monitoring.
Inference uses a trained model to make predictions or decisions on new, unseen data. This is the ML stage where the generalization happens.
Inference monitoring is critical to get your model into production reliably. By definition, a model trained on a sample of data cannot understand the full population in the wild. As your model scales, you'll find more and more edge cases. You'd be wise to use these edge cases to upgrade your model using techniques like active learning.
This way, you will build a train-and-sustain strategy instead of a deploy-and-hope strategy. Together, these steps form the data flywheel approach. The idea is to wrap the ML model development process into a continuous improvement loop.
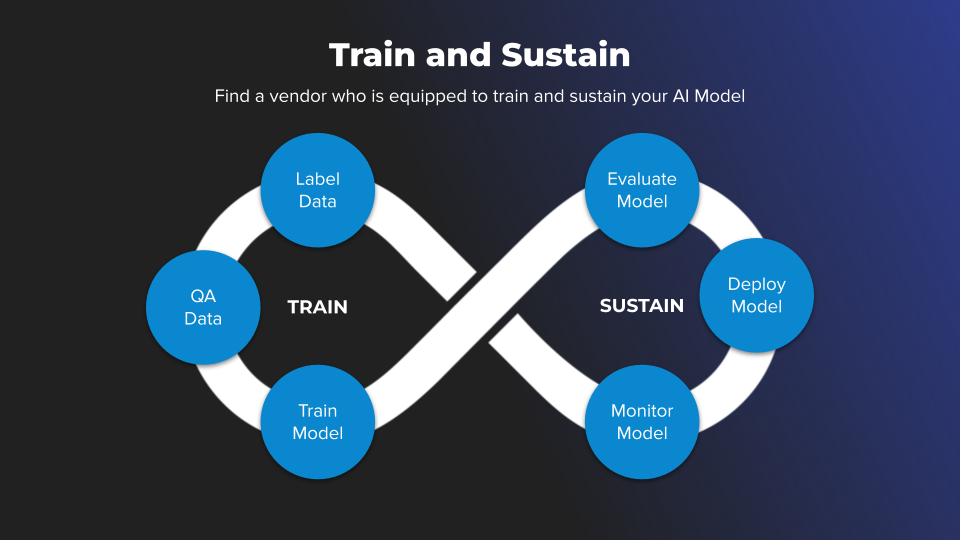
The data flywheel system in production
In addition to active learning, you can build some logic to check whether your model is performing as intended. For example:
- Select a particular ML metric and track it. If the metric on inference is underperforming on a specific data sample, you can automatically send such data samples to the annotation workforce. This will help you identify data samples that are causing the model to perform poorly and make sure they are annotated correctly.
- Let users report when something is not working as intended. This can be done through a feedback form or a chatbot. This will help you identify issues that users are having with the model and make sure they are addressed.
- Use a data catalog tool to find the instances your model struggles with. This can be a manual process, but it can help identify data samples that are causing the model to perform poorly. However, this is not a scalable solution and should only be used as a last resort.
If you are building a project that will scale over time or experience different traffic loads, it's a good idea to use a semi-automated inference engine (IE) – an engine that takes images as input and returns predictions as output.
Beyond the monitoring capabilities, it scales according to your traffic load. If you experience a high traffic load, more servers are used, and if the traffic reduces, less GPU capacity is exploited. Thus, you do not need to have GPUs running every hour – with our API, for example, you can configure them to be used only when the traffic is active.
Key takeaway: After deploying the model in production, try to build a smooth feedback loop so that your model can improve its weaknesses and adapt better to real-world input. Modern techniques can draw your attention to the right cases needing HITL interference.
CloudFactory understands the building blocks of the ML hierarchy
With the right data labeling partner, you can achieve ML self-actualization and create models that make a real impact on your business.
CloudFactory has been supporting ML teams for over ten years, and we know what it takes to build a successful ML foundation.
We understand the ML hierarchy and can help you optimize your annotation strategy, train your models effectively, and deploy them to production. Our managed workforce solutions provide you with expert annotators working as an extension of your internal teams without the headache of actually running one.